
BLOG
How I Built My Own Earthquake Detector Using IoT

This past summer and now, in my off-time, I’ve been building a real-time Japanese earthquake monitor. Since I’ve been told that this is not an extremely common way for someone to spend their extra hours, I thought the project merited a deep-dive explanation, complete with some examples of how it works:
Why Build an Earthquake Detector with IoT?
I’ve been fascinated by the Japanese language, technology and culture for a long time. A few years ago that interest intersected with a tragic event in the country’s history.
In March of 2011, the largest earthquake to ever hit Japan – with a 9.1 magnitude on the Richter scale – set off a chain of events including a tsunami and a nuclear meltdown that resulted in the deaths of more than 20,000 people.
This was not the first severe earthquake Japan experienced in modern history, and it won’t be the last. The island nation spans four different tectonic plates, with volatile fault lines that cause about 1,500 earthquakes in the country on a yearly basis. The area is known by seismologists as the Pacific Ring of Fire.
Earthquake monitoring, therefore, is hugely important for disaster prevention in Japan. The country has an earthquake warning system that uses data from underground sensors to automatically alert citizens via phone and television. It was this system that may have actually saved many lives back in 2011, by giving people precious seconds to get to safety.
Improving Existing Technology
If Japan already has its own earthquake detection system, why would it need me, a native Mac OS iOS developer based in St. Louis, Missouri, to build a new one?
I wanted to find a way to see if I could improve on the technology that is currently available. I’d also like to see what I could do to give people even more notice that an earthquake is coming, and potentially save lives.
Due to the nature of the current Early Warning system, many parts of it use outdated technologies that either limit who can see the data for earthquake events, or limits how the data can be used to quickly broadcast messages to clients that new events are occurring. These important programs continue to operate on legacy systems with technologies that would be considered antiquated by high-tech companies around the world. There have been some attempts to modernize, but these have often resulted in false positives, meaning Japan’s earthquake warning system has frequently notified millions of people that a high-magnitude earthquake was coming when it wasn’t.
These realities led me to think about what I could do to help. I noticed that there was an opportunity to access the data that Japan’s sensors pick up, and then display and aggregate this data for Mac OS. (Japan’s systems are predominantly Windows-based, as Windows was one of the first operating systems to support the Japanese language character set.)
What I ended up creating – which I’m still modifying and iterating – was a real-time earthquake monitor for Japan that frequently alerts to seismic activity three to four seconds faster than Japan’s own system.
How I Built an Earthquake Detector Using IoT
About eight months ago, I started working on the weekends to figure out how I could make this dream a reality.
So, how do you build an earthquake monitor for a country more than 6,000 miles away when you’re not an expert in seismology or meteorology, and you’re not a fluent speaker of that country’s language? (I do speak/read Japanese, but I’m currently at an elementary level.)
Understanding Seismology & How Japan Measures Magnitude
To make this product successful, the first thing I had to do was research – and lots of it. I needed to make sure that the monitor accurately represents what’s happening, according to the measurements that Japan uses for earthquake magnitude.
While the United States uses the Richter scale to measure earthquake magnitude, Japan uses the Seismic Intensity, or Shindo scale. The Shindo scale, rather than measuring magnitude, measures factors like peak ground acceleration and duration of shaking. If you live in a place like Japan that experiences such frequent earthquakes, this scale makes a lot of sense because it’s more helpful in determining the actual impact the event will have on communities and infrastructure.
| Intensity | Description |
|---|---|
| 0 | Imperceptible to most people. |
| 1 | Perceptible to some people in the upper stories of multi-story buildings |
| 2 | Perceptible to most people indoors. Wakens light sleepers. |
| 3 | Perceptible to everyone indoors. Frightens some people. |
| 4 | Frightens most people. Some seek escape. Wakens most sleepers. |
| Lower 5 | Most people try to escape from danger by running outside. Some people find it difficult to move. |
| Upper 5 | Many people are considerably frightened and find it difficult to move. |
| Lower 6 | Difficult to keep standing. |
| Upper 6 | Impossible to stand; cannot move without crawling. |
| 7 | Thrown off by the shaking and impossible to move at will. |
Another thing that I needed to understand was how and when an earthquake generates seismic waves, so that I could track them accurately and figure out the earliest possible moment I could notify my users of an impending earthquake.
Japan’s seismometers track a few different kinds of waves both below and on top of the Earth’s surface that are relevant to my monitor. The P, or primary preliminary wave, is the first to be detected by the sensors, so being able to catch this wave, predict intensity, and send a notification to users as quickly as possible is critical.
The P wave is followed by the S, or secondary preliminary wave. Surface waves cause the majority of earthquake damage, so while they are important to track, it’s most valuable to notify people of an earthquake before they hit.
Finding and Mapping the Data
After gaining an understanding of what I would be tracking and looking for, my next question was, “Where is the data, and how do I get to it?” My hope was that there’d be a REST API I could call to get the data from multiple Japanese stations and pull it into my application, but I had no such luck.
After a lot of searching. I finally discovered a way to access Japan’s public seismic data – through images. In my earthquake monitor now, there’s a service running in the cloud that grabs image data every second from six different Japanese sources.
Then, using both my own algorithm and Japan’s algorithm, the cloud service aggregates all of the data and comes up with a prediction to decide: is a seismic event happening? If something is happening, how severe is it? Should a warning be issued?
To display all of the raw data in a way that makes sense, my application meticulously scans each pixel of the incoming images to make sure the right data is associated with the right sensors (there are about 4,000 across Japan). Because the data about the earthquake’s severity is displayed through colors in the original format, I also had to train my system to associate colors with intensity level on the Shindo scale.
My Earthquake Monitor in Action
The earthquake monitor’s client is built in Swift for Mac OS, and the service layer is running Node.js and using WebSockets for communication so that it can be as real-time as possible.
Here are some examples of my Earthquake monitor in action. The animated GIF below gives you an idea of how the system works (rather quickly), so I’ll break it down in static pictures after this. Here is an earthquake from late last year, just off the coast of Fukushima, in the Tohoku region of Japan:

What you are seeing here are all the nodes in blue starting to change color based on the intensity of the motion that is perceived at each station. As the shaking increases, they begin to climb the Shindo scale and you can see that it gets quite intense. The blue ring indicates the P wave (the preliminary wave), and the yellow indicates the S wave (the surface wave). Remember the P wave creates light shaking and the S wave is the more destructive wave.
Here is another example:
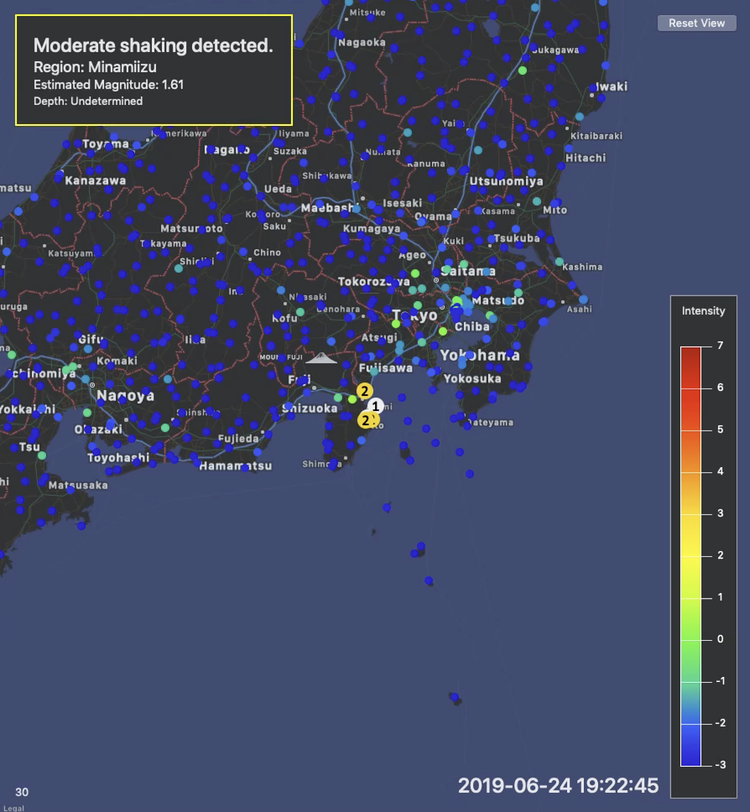
In the case above, you can see that my application has detected moderate shaking near Minamiizu. This is the early detection that I’ve been trying to improve upon. Note the timestamp, 19:22:45….
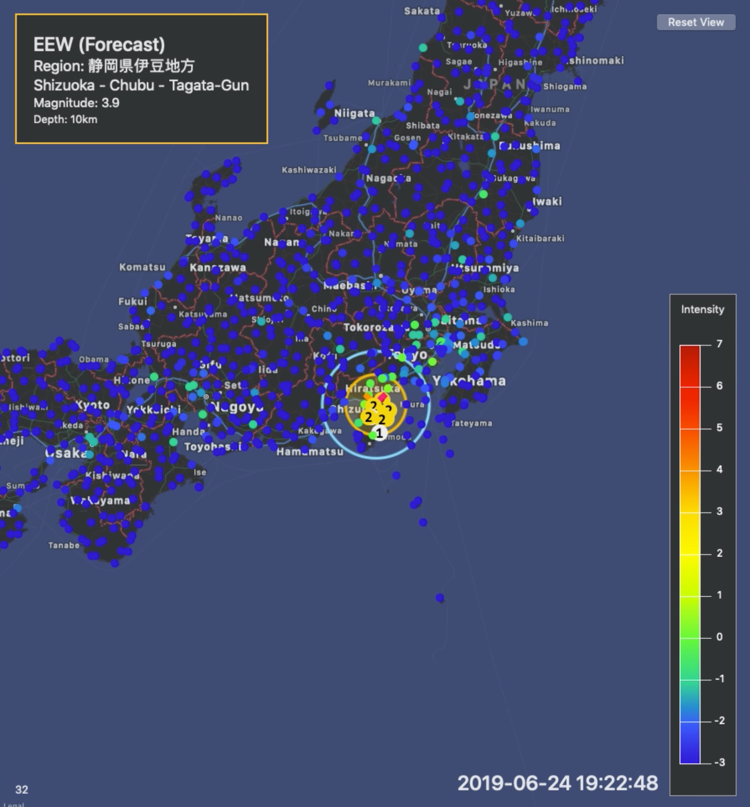
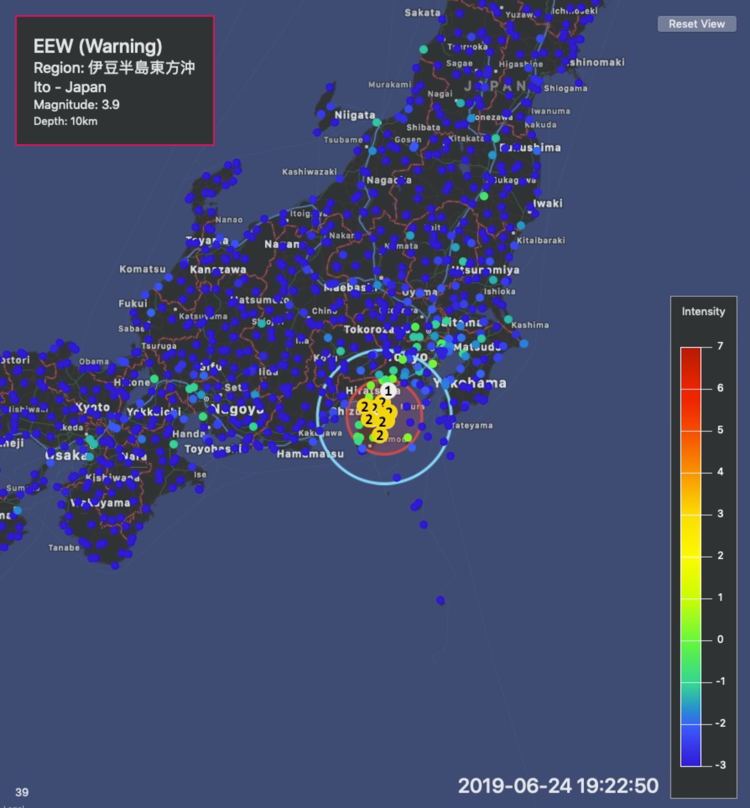
Here is the same earthquake (slightly zoomed out now). At 19:22:48, the first Earthquake Early Warning Forecast (EEW) had officially gone out. My detection, in this case, was almost three seconds faster than the issued EEW. Finally, this Earthquake was detected to be capable of producing strong shaking and was upgraded from a Forecast to an official warning:
Here, you can see the S wave (which was yellow) has now turned to red, to indicate that the strong motion starts ‘around’ this area.
What’s Next?
My immediate plan is to continue to improve this application and then release the first public version on the Mac App store this Spring. (Check back here for an update, with a link to the App Store), so that you can come in and check out the application for yourself.
There are some final features that I’d like to add, one being a location pin, where you can set your current location and get a ‘Countdown’ or even set settings on how you’d like to be notified (over a certain intensity, etc).
Visually, I’ve continued to focus on the UI/UX of the application so that information is quickly available and understood.
Finally, I’d also like to add replayability, so that you can see events from the past, without looking at them on animated gifs (my current scheme for replaying events).
Overall, I’ve learned a ton, and I’ve had the chance to put my skills to the test. This has been one of the neatest projects I’ve ever built in my free time. I’m looking forward to taking what I’ve learned and applying it to the client work that I do here at Very. Additionally, the new things I learn on other projects will go right back into improving this project over the long term!
Would you like to work with me and my awesome colleagues at Very on your IoT project? Reach out to us today.