WHITEPAPERS
Predictive Maintenance Adoption: Overcoming Common Data Quality Issues
Data quality issues often prevent manufacturers from launching successful predictive maintenance strategies. By combining data best practices with the right application of machine learning, however, manufacturers can overcome the data quality problem and benefit from a superior predictive approach to maintenance.
Why Prediction for Manufacturing Maintenance?
It’s no secret that downtime is the major productivity killer for manufacturers. And if you’ve read our previous whitepaper, Predictive Maintenance for the Connected Plant, you know that only 12% of plants take a predictive approach. Those manufacturers who do adopt predictive maintenance strategies maximize their throughput and save as much as 40% compared to those using inferior maintenance strategies.
Predictive maintenance helps minimize downtime by determining potential points of failure in an unexpected outage. It detects incipient failure before it causes downtime and maximizes the remaining useful life of machine components. But with so many factors to consider, preventing downtime becomes an elusive goal.
That’s where machine learning (ML) comes in.
Why Use Machine Learning?
Machine learning enables manufacturers to synthesize vast amounts of data with the click of a button. Considering that a single machine on the manufacturing floor can generate 5.4 million data points in an hour, this capability is invaluable for manufacturers looking to prevent unplanned outages. Even with the help of Excel and smart pivot tables, finding value in such a trove of information would be difficult at best — and evaluating that data in time to prevent an outage would be nearly impossible.
In short, ML synthesizes vast amounts of data so that manufacturers can act quickly and make decisions that lead to greater efficiency gains.
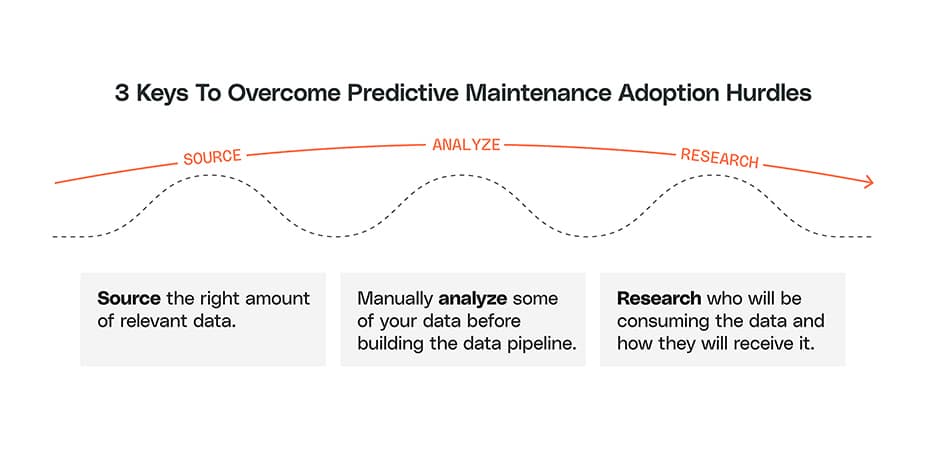
The Top Three Hurdles to Predictive Maintenance Adoption
A predictive maintenance program can be complex. These are the most common hurdles we see in adoption.
1. Sourcing and Maintaining Quality Data
Machine learning only works if you’re working with the right type of data. Your data should be clean and related to what you’re working to predict.
Before you launch a predictive maintenance program, make sure you have a clear view of the product you’re building and what role ML plays in that product. Ask yourself:
- What is your hypothesis?
- What kind of data do you need to test that hypothesis?
- Can you access this data?
- Who needs access to the results?
Knowing the answers to these questions is the first step in ensuring you’re sourcing the right kind of data.
Overcoming the Data Source Problem
Most companies find themselves tackling one of two data-related problems. They either don’t have any data at all, or they’re drowning in floods of data without a clear view of the problem domain. Finding the causal data is part of the iterative predictive maintenance workflow.
If predictive data doesn’t yet exist in your facility, you can gather it by taking inventory of your available resources, retrieving the data out of your existing tooling, and incorporating new sensors to supplement where data is lacking. Too much data is a good problem to have, but you’ll still want to weed out irrelevant data to reduce storage and processing costs.
You’ll also want to make sure your data is clean — removing missing data points, eliminating duplicate data, resolving impossible-to-achieve results, etc.
2. Automating the Data Engineering Process
Manufacturers that begin automating their data engineering process blindly are at risk of introducing technical debt to their system by choosing a data structure that doesn’t match the algorithm they need. To avoid this, align early with production subject matter experts, designers, and product teams to understand their requirements.
Before Building Your Pipeline, Know Your Data
Manually analyzing your data can save significant time and effort in the automation process. Start with the problem you’re trying to solve. What algorithms are likely to provide the most useful information? Now you can structure your data with all of the features you’ll need to run those algorithms.
Remember that the sophistication of your approach is based on the maturity of the project. Features will likely increase over time. In the beginning, your data pipeline may be as simple as moving the data from one place to another. By planning ahead with a focus on both the problem and end-user needs, you’ll avoid painting yourself into a structural corner or wasting effort on work that doesn’t align with your goals.
3. Presenting Usable Output Data to the Right People
People often tout the power of machine learning but neglect the delivery. For example, the typical output from a machine learning model is a .csv file — a data format that’s notoriously unfriendly for users trying to quickly find actionable information. We’ve seen companies put in significant effort to generate data, only to have a .csv file buried in a folder somewhere and left to collect dust. Ideally, outputs (.csv files or otherwise,) are ingested and displayed by a user-facing software product that transforms the insights gleaned from modeling into actionable steps.
Identify Who Needs to Know and How They Access Information
Start your project by defining who needs access to the information. Often, this person is in a unique environment — they may be operating machinery and not have access to email or even a traditional computer during their shift. As you define the ideal output of the tool, consider how these stakeholders will receive information. What information do they need to see, and in what format?
We often find that organizations choose to display information in some form of software as a service (SaaS) application. Building a SaaS application means developing an additional fully fledged tech stack and hiring software engineers, designers, web developers, and operations specialists to manage and maintain the application.
At Very, we know that data science is only one part of the complete solution and that it’s essential to fully grasp the potential implications of a project before getting started.
Starting with Predictive Maintenance
Predictive maintenance delivers a massive return on investment, despite the challenges that might be associated with it. (Not sure you want to tackle it on your own? Very can help!)
Prediction requires a large amount of clean historical data. We find when we first start projects that there’s often not enough information about the machines and their failures available to build reliable, supervised models.
How is predictive maintenance possible without access to historical downtime data?
Very approaches projects by starting with simple approaches and increasing their complexity over time. Furthermore, we always deliver some type of user-facing product for every step along the way.
If we don’t have enough labeled data (for example, if the machines are newly installed), we’ll start by using basic statistics to build outlier detectors to detect anomalies within the sensor values.
When detecting anomalies, we look for data points that don’t fit within a group. For example, if we’re looking at the vibrations on a particular bearing, these outliers could predict a deviation from the norm that may indicate an impending failure. This strategy can be applied to all types of data to discover and label scenarios that lead to device failures.
Making the Best Predictions With Available Data
Before diving into how to use machine learning to make the best predictions with the available data, it’s necessary to understand a critical distinction between the two primary ways machines learn. When we use the word “prediction,” it implies the use of historical data — lots of it — to make educated guesses about the likelihood of recurring incidents. This data, labeled with the type of failure, is where the distinction between learning methods lies.
Supervised vs. Unsupervised Machine Learning
Supervised machine learning requires a labeled training set. This means there’s a known output to train the model. For example, if we’re trying to predict when a bearing will fail, we need a known set of data on failed bearings that we can use to train the model.
If we don’t know what the output should be, or don’t have enough historical labeled data on which to train the model, we can use what’s known as unsupervised machine learning. If we are trying to predict if a bearing will fail, we would need a labeled training set to train the model. But if we’re predicting how long a bearing will last, we don’t need a labeled training set because we don’t know what the output should be.
Use Unsupervised Learning for Unstructured Data
Unsupervised learning can help you make sense of data you’ve gathered by automatically discovering features correlating with the results you hope to achieve. In unsupervised machine learning, the algorithm must find the output independently. Two standard techniques to be aware of here are clustering and the use of autoencoders.
Clustering
Clustering is a technique that involves grouping similar data and then labeling those groups by name. For example, you might have data points about bearings and group them by how long they last, calling one group “Long Lasting Bearings” and another group “Short Lasting Bearings.” In this way, you have discovered two groups of bearings with different lifetimes — without knowing what those lifetimes are ahead of time.
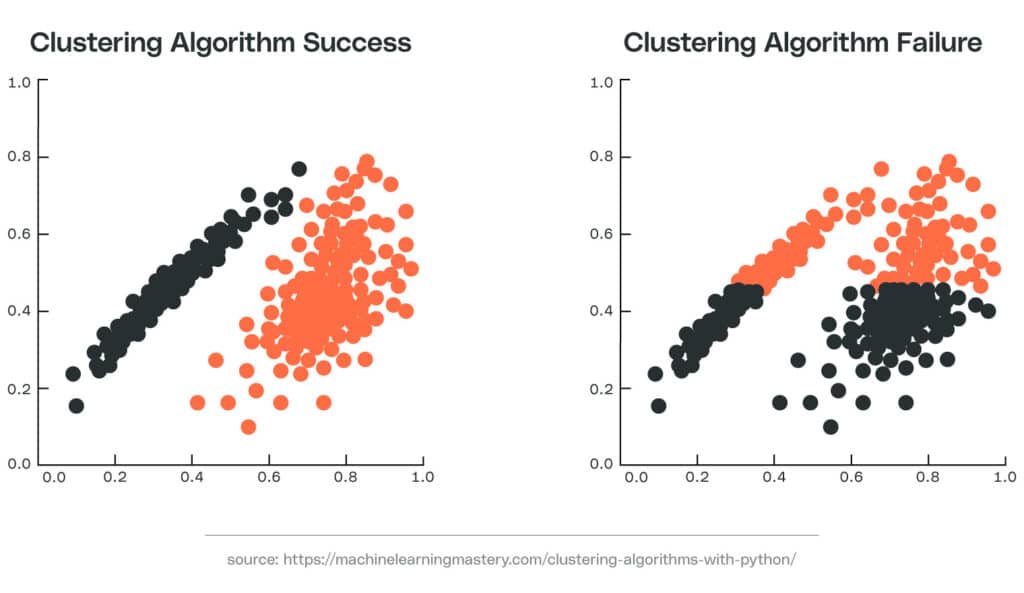
Imagine your facility has bearings that operate under a high vibrational frequency with a short lifespan. Others operate under low vibrational frequency and last longer. If the frequency and lifespan of these two types of bearings vary significantly, you might expect to see two different clusters when you plot individual bearings on an x (lifespan) and y (frequency) plot. Using this information, you can group future bearings into one of these different clusters to estimate the lifespan of the bearing and to determine when to schedule maintenance.
Uncovering this data helps to determine an optimal timeframe to replace bearings before the point of failure — while also avoiding premature replacements, which increase operational costs.
It’s important to note that the clustering algorithms you choose to use may not adequately differentiate between clusters. If you use these algorithms and don’t notice the clustering error, you may incorrectly estimate the life of a bearing, potentially leading to an unexpected failure.
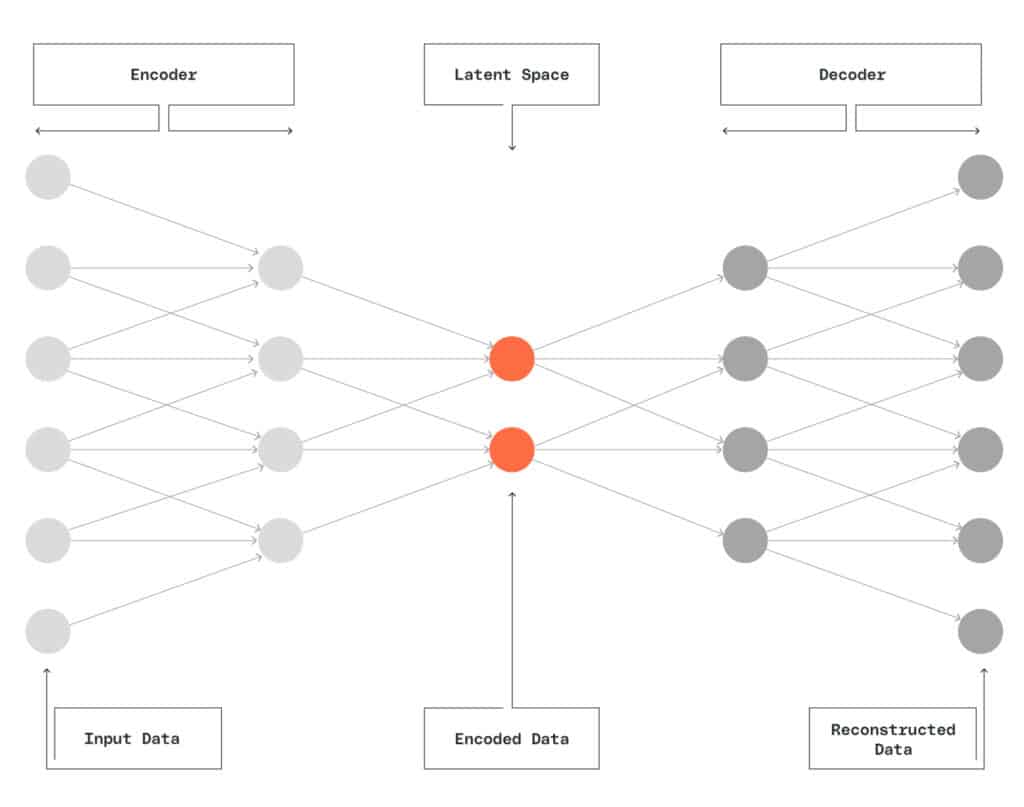
Autoencoders
Autoencoders are artificial neural networks that encode input data into a hidden layer before decoding it as output data. These networks learn what features are important to make predictions — without being told what those features are ahead of time. They’re also good at finding outliers within datasets for more sophisticated anomaly detection.
Supervised Learning Maximizes Predictive Potential
Supervised learning uses labeled data to train ML models. In an industrial setting, this data can represent specific failure states of the machines being monitored. However, labeling by hand has the potential to allow bias to interfere. Labeling may also require domain expertise that makes it difficult to scale.
Automatic Labeling
In some instances, we won’t have a known output on which to train the model. If this is the case, that means we’ll have to label the data ourselves. Manually labeling data is often time-consuming and expensive, which is why it’s best practice to label data systematically when possible. In some cases, however, there’s no way around manual labeling.
Manual labeling requires extreme caution on the manufacturer’s end. Unsupervised data labeling — like grouping bearings together by how long they last — can introduce bias. Deciding ahead of time that bearings with lifetimes less than 100 hours are “bad” and bearings with lifetimes greater than 100 hours are “good,” for example, is introducing bias into the data. That means the model will learn from the bias instead of from the actual data. When we label data in a supervised manner — such as labeling failed bearings as “bad” and non-failed bearings as “good” — we can introduce bias into our data and still get valid results from our model. However, this doesn’t mean it’s recommended to introduce bias into the data.
At times, it’s recommended to start with unsupervised labeling and then follow with supervised machine learning. That way, the model is primed to learn the important features for making predictions without being influenced by unnecessary bias. But if you do plan to use an unsupervised classifier to label, be sure to check the labels for accuracy first. You’ll introduce incorrect labeling and train your model incorrectly if your classifier is wrong. (This is just one example of why you want to exercise careful testing in deployment.)
Alternatively, you can label data by hand using a structured system, like building an application that requires operators to input a failure code when a machine goes offline. This code can be used along with the timestamp to label the sensor data generated.
Modeling Predictive Maintenance
In general, you’ll use one of two predictive modeling approaches when working with labeled data.
Regression models predict the remaining useful life of a component, estimating how much time remains before failure. Regression models require as much historical data as possible to work properly. You’ll need to track every event and, ideally, represent every type of failure.
A regression model assumes that, based on the inherent (static) aspects of a system and its performance in the present, the remaining lifecycle is predictable. However, if there are several ways in which a system can fail, you’ll need to create a separate model for each possibility.
Classification models predict machine failure within a specific window of time. In this scenario, you don’t need to know far in advance when or if a machine will fail — only that failure is imminent. This model supports multiple types of failure, allowing you to group incidents under the same classification. The success of a classification model depends on availability of substantive data and notable features denoting each type of failure to inform the ML model.
Regression and classification models are similar in many ways, but they fundamentally differ in that regression output variables are continuous while classification output variables are class labels.
Non-Gaussian Distributed Input Data
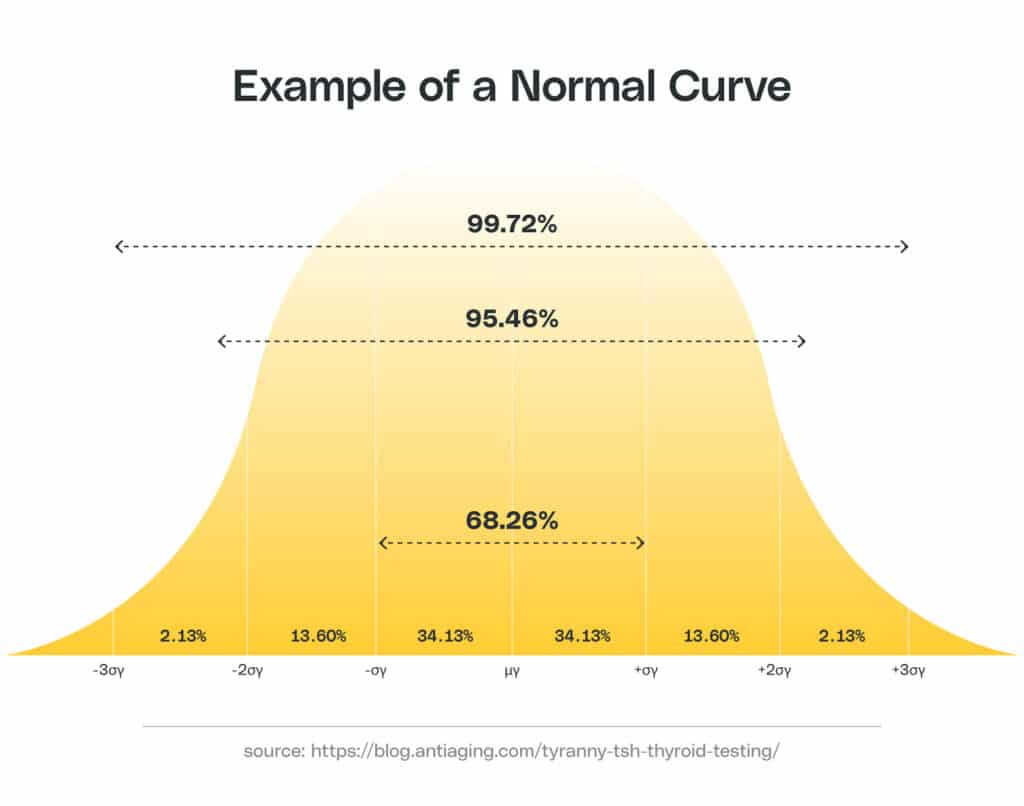
Many ML algorithms will assume your data is Gaussian by default, which means they won’t perform as well if your data doesn’t conform to a Gaussian (or normal) distribution. Small sample sizes often result in data with skewed, non-Gaussian distributions, so it’s best to start by confirming that you have an adequate number of data points.
If your input data continues to remain skewed, you may wish to address this problem during feature engineering by using mathematical transformations to make the data more Gaussian. Alternatively, you could find a resolution during model selection by choosing a model (such as a tree-based model) that does not depend on Gaussian inputs.
Example normal curve:
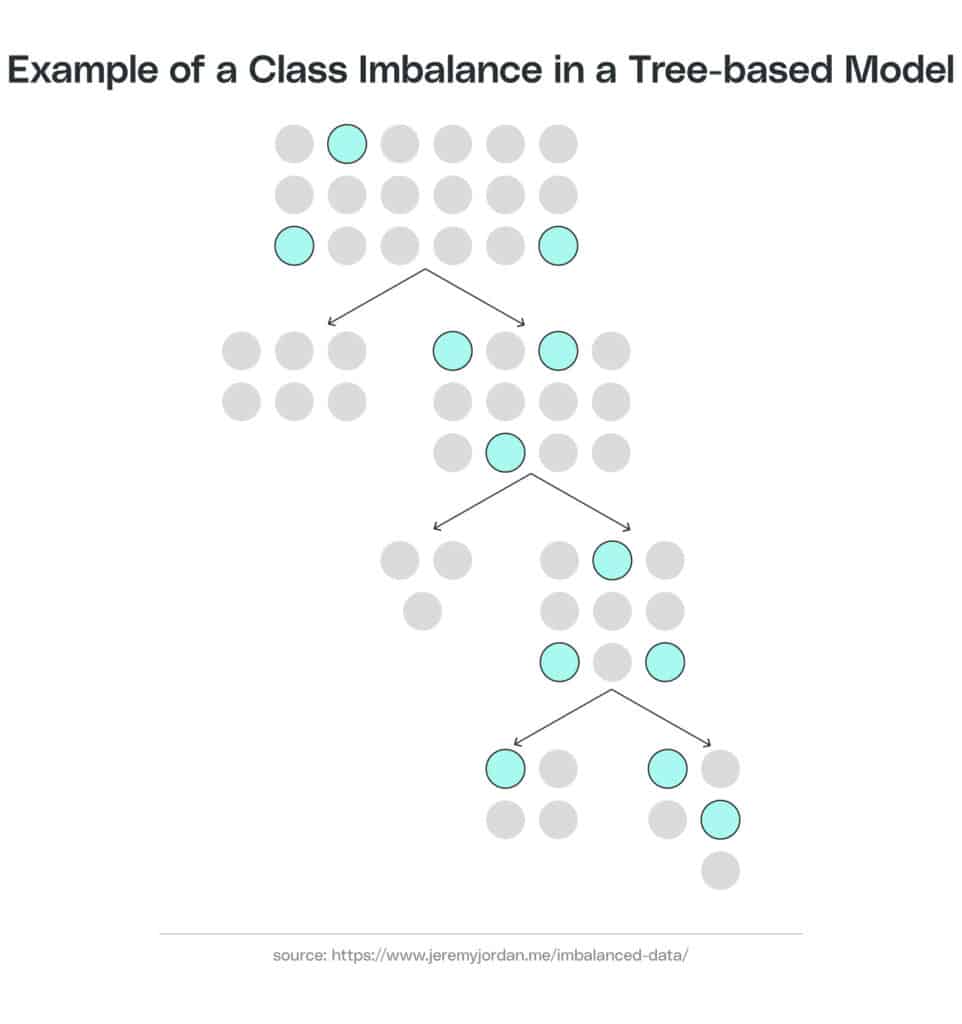
Class/Label Imbalance
A class imbalance problem presents a unique challenge. If the algorithm has several examples of successful behavior, and only a few examples of part failure, this could result in an imbalance. We often represent this imbalance as a binary system, with results falling into one of two classes. In this case, the binary classes would be “successful” and “failure.” The severity of an imbalance might be slight, but it could also be as high as 1:10,000 or more.
Fortunately, there are various ways to tackle class imbalance during training to help reduce a model’s bias towards a particularly over-represented class. A simple approach would be to oversample your underpopulated class until the class becomes proportional to the over-represented class. More sophisticated methods, such as Synthetic Minority Oversampling Technique (SMOTE), generate new synthetic data points for the under-represented class.
Example class imbalance in a tree-based model:
Final Thoughts
Manufacturers who adopt predictive maintenance maximize their uptime, but many are missing out on the benefits of this approach because of implementation hurdles.